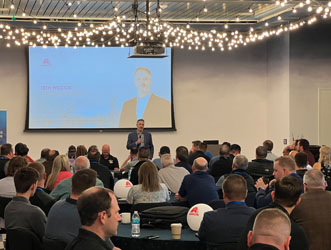
Susanna Gotsch says drivers are back out on the roads, but changes in driving patterns are still more adversely impacting the number of claims and shop repair orders.
Gotsch, data analyst for CCC Information Services and the lead-off speaker at the virtual MSO Symposium held in November, said vehicle miles traveled has rebounded nationally to within 5% of “normal,” but that traffic congestion---and the claims that result---has not.
She cited a number of statistics affecting congestion. A study of 3,600 office buildings showed, for example, that occupancy rates that were near 100% in many metro areas are now below 30%.
“While many businesses are still operational, they continue to keep their employees working remotely,” Gotsch said, noting automakers and high-tech firms are among the companies already announcing they will keep their employees working from home at least through next June.
Similarly, although 14 states have 90% of students in classrooms some or all school days, nearly two in five K-12 students nationally still attend schools offering only a virtual option.
These changes cut morning and afternoon commute traffic significantly, Gotsch said, noting those are the times of day in which federal data indicates about one-third of all accidents occur.
The rebound in vehicle travel is happening with less congestion in part because of travel during non-peak time---online shopping deliveries occur across a broad swath of the day, for example---and in part because of longer trips by those avoiding air travel.
The end result, Gotsch said, is claims remained down about 24%, year-to-date, in early November. But there is a broad range of market variation in that statistic.
Gotsch’s data shows the Phoenix market, for example, was down just 18%, year-to-date, as of November; Atlanta, Charlotte and the Riverside-San Bernardino area in California all had claims counts down less than 23%.
At the other end of the spectrum, hardest hit among large markets are Washington, D.C., San Francisco, Seattle and Boston, where claims are down between 31% and 33%.
The good news for shops is their volume of repair orders is not that far below normal, Gotsch said.
In the middle week of March, shops in states with minor restrictions saw repair order volume dip by 17.5% compared to the same week in 2019, followed by a week with a 22% decline from the preceding year. The stats were even worse for shops in states with major COVID-related restrictions, where repair order volume was down by 24% and 30% in those same weeks in March.
By late October, however, repair order volume had rebounded to being down about 10% compared to the same period last year.
“With overall volumes continuing to be down slightly, we do expect that in 2021, claims counts and repair order counts will be much better than they were in 2020,” Gotsch said. “But we do expect overall volume will be less in 2021 than it was in 2019.”
Gotsch shared a variety of other statistics during her presentation during the MSO Symposium.
Cost of repairs, she said, has been up year-over-year in every month this year through September. For the 12 months ending the third quarter of this year, the average total cost of repairs was $3,297, up $156, just shy of 5%, compared to the same period a year earlier, and up $487---more than 17%---for the same 12-month period ending in 2016.
That’s based in part on a more than 2% rise in non-drivable vehicles after higher-speed crashes made possible by less vehicle traffic, she said, along with increases in the cost of parts and higher costs in the “miscellaneous/sublet” category, “which is where a lot of the fees associated with scanning and calibrations are appearing.”
A line item for scanning was included on 41% of appraisals in the first quarter of this year, she said, compared to just 3.3% in the same period in 2017. The average fee for scans across appraisals that include them is $126, she said.
Looking at DRP claims only, shops in the second quarter of this year averaged 3.5 labor hours per day on drivable vehicles and 2.9 hours on non-drivable vehicles; that was up from 3.3 labor hours on drivable vehicles and 2.8 hours for non-drivable for the same period in 2019, but down slightly from 3.6 labor hours for drivable and 3 hours for non-drivable in 2018.
Fewer repairs in shops in the second quarter also led to improved cycle time, Gotsch said; from “vehicle in” to “vehicle out,” cycle time fell to an average of 9.1 days, down nearly a half-day from the previous quarter, and down from 9.7 days in the second quarter of 2019.
For the 12 months ending with the third quarter of this year, 60.5% of claims had supplements, up from 55.8% a year earlier and up from 52.9% for the 12-month period ending in 2018, and those supplements accounted for 18.7% of the total cost of repairs, up from 18.1% and 16.9% in the two prior years.
The percentage of vehicles declared total losses has continued to increase, despite a rise in used vehicle pricing this year.
“We’re now at a point where roughly 22% of all non-comprehensive appraisals are being flagged as total loss, which is a substantial increase considering that even 15 years ago, only about 10% of all vehicles were flagged as total loss,” Gotsch said.
That is likely to rise even higher next year, she said, given the expected 15% decline in new vehicle sales this year.
“The vehicle fleet will continue to shift older for the next several years,” Gotsch said. “Many fewer vehicles were purchased [this year] by fleets, which ultimately supplies the used vehicle market, and that will help keep used vehicle prices elevated, but as repair costs continue to rise and may outpace that, that will continue to push up the total loss frequency.”


John Yoswick