
PartsTrader data indicates parts delays have eased over the past 12 months, the company reported in a recent webinar. Across all part types---OEM, non-OEM, used and reconditioned---the median delivery time has been steady across the past year at just above one day, according to Greg Horn, chief innovation officer for PartsTrader.
But if nine out of 10 parts needed for a job typically all arrive promptly, Horn said, it’s the outlier that tells more of the story.
“Averaging dilutes the impact of that one part out of 10 that is significantly delayed,” he said. “By looking at the median plus two standard deviations, you capture 95% of the population.”
That number stood at 11.9 days in May, according to PartsTrader data, Horn said. That’s down significantly from 13.3 days in January, and from 14.7 days in mid-2022---even if it remains higher than the 7.4 days in the first quarter of 2021.
“It’s a good sign that we’re returning toward more on-time deliveries, fewer back-ordered parts,” Horn said.
Part Price Inflation Trends
Horn also shared some PartsTrader data on parts price inflation. The average cost per recycled part in May was $325, up 6.2% from the end of 2022, and up 12.8% from the average ($288) at the end of 2021.
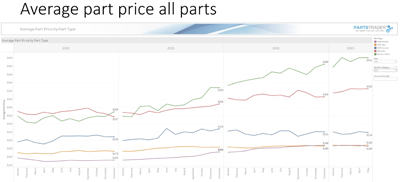
Interestingly, the rise in new OEM parts and non-OEM parts has been significantly lower---and by one measure, the average price of the two types of parts is virtually identical. The average price per new OEM part in May ($189) was up just 3.2% from the end of 2021. The average price per non-OEM part had been trending below OEM parts until the fourth quarter of last year, when the average price of the two types converged because non-OEM parts prices had increased faster (about 9.4%) than OEM since the end of 2021. The average OEM part in May was just $3 more than the average non-OEM part.
But Horn also noted those comparisons include all parts that the OEMs produce, including lower-cost parts such as clips and emblems that non-OEM parts manufacturers don’t offer.
So he ran the same data looking only at top volume parts---bumpers, doors, fenders, lamps and hoods---often available in both OEM and non-OEM versions. That comparison shows both a significantly larger difference in average part price between OEM ($534 as of May) and non-OEM ($316), and more of a difference in parts price inflation between the two.
The average price for those high-volume OEM parts is up 16.8% since the end of 2020, including increases in 2021 (4.8%), 2022 (7.7%) and in the first five months of this year (3.5%). By comparison, the average of those types of non-OEM part price rose sharply (25%) from the end of 2020 until the end of 2022---but has remained basically flat this year.
Industry consultant Terry Fortner, who participated in the webinar with Horn, said that change is likely due to increased cargo costs to import non-OEM parts during the worst of the supply chain issues, which have eased more recently.
EV Sales Accelerating
Turning to the topic of EVs, Horn said EVs accounted for 7% of new car sales in the first quarter of this year, up from 4.6% during the same period last year. He pointed to the rapidly increasing number of EV models available, from fewer than 50 in 2021 to 125 or more this year, and more than 150 by 2026.
“Mercedes-Benz alone launched seven new models of full EVs,” Horn said. “You see price reductions from Tesla. You see more and more vehicle types. So now the share of EVs in the U.S. car [fleet] is 3.69 million. That’s roughly about 1%.”
By 2030, EVs are expected to account for 28% of new car sales, and 8% of the U.S. vehicle population.
A 2022 study by European insurer AXA found EVs in that market are involved in 50% more traffic accidents than internal combustion passenger vehicles.
“But think about how fast EVs are,” Fortner said on the webinar. “If you own a Tesla or have driven one, they are rocket ships. And If you think about the owners of electric vehicles, if you look at the demographics, they are generally in cities, highly-populated areas. The density creates more likelihood of accidents as opposed to being in the countryside.”
Horn said the weight of EVs is likely to cause more damage than lighter vehicles in crashes. While the average passenger car is about 3,700 pounds, he said, the Ford Mustang Mach-E, Hyundai IONIQ 5 and Tesla Model 3 are more than 4,600 pounds, the Rivian R1T is 7,148 pounds, and the Hummer EV is more than 9,000 pounds.
“That’s quite a fulcrum when it hits another car,” Horn said.
He also shared photos found on social media of what appears to be a light hit involving a Toyota rear-ending a Rivian R1T.
“It looks like it was just an impacted rear bumper,” Horn said. “But [the owner] took it to a certified Rivian shop---you can see a full tear-down here, including removing the entire bed---and they came up with $42,000. The initial estimate that was done with photo-based estimating…was $1,600. The insurance triaging seems to have missed the mark by a bit.”


John Yoswick